As a fuel retailer, you have access to a lot of data – but how easy is it for you to see it all in one place?
Good data visualization takes complicated data from a source and makes it visually appealing, in order to create a simple yet powerful message that can be used to make important decisions for your business”.
Raw data can be overwhelming, so having everything compiled in a table, map or chart can help you identify specific patterns and trends.
We live in a visual world, where imagery is extremely important. Businesses are always transforming and becoming more complicated. Previously, business owners could keep track of everything with a notebook, whereas nowadays they are using machine learning and impressive software to gather crazy amounts of data able to predict the types of customers that come to their shop and how much they are likely to spend.
One might say “well, I have been in my industry for 30 years and I do not need any software to help me make decisions or analyze trends”. While it is true that experience has a huge impact on the success of a business, it is important to take into consideration competition. In other words, it is too risky to stay complacent just because of experience.
In today’s environment, industries and technologies change constantly and it is very easy to remain stuck in place due to an apprehension of change. The business men and women who embrace change instead of “rowing against it” will be much more likely to succeed compared to those who don’t have the interest in adapting a business through time.
Another added benefit of data visualization is its ability to increase the speed of decision-making. Faster decision making is extremely valuable to business owners as it can increase the profitability of decisions and give them more time to focus on other aspects of their business.

How can fuel stations use data?
Everyone knows that the fuel retail market is based on tight margins and optimizing profits as much as possible. C-stores and stations always look for a competitive advantage such as improving facilities or lowering price of fuel by just a cent compared to nearby competition. Recently some major chains have even started to offer loyalty programs and their own “customer reward card”.
Loyalty programs not only give consumers a reason to visit your station, but they capture data on customer habits.
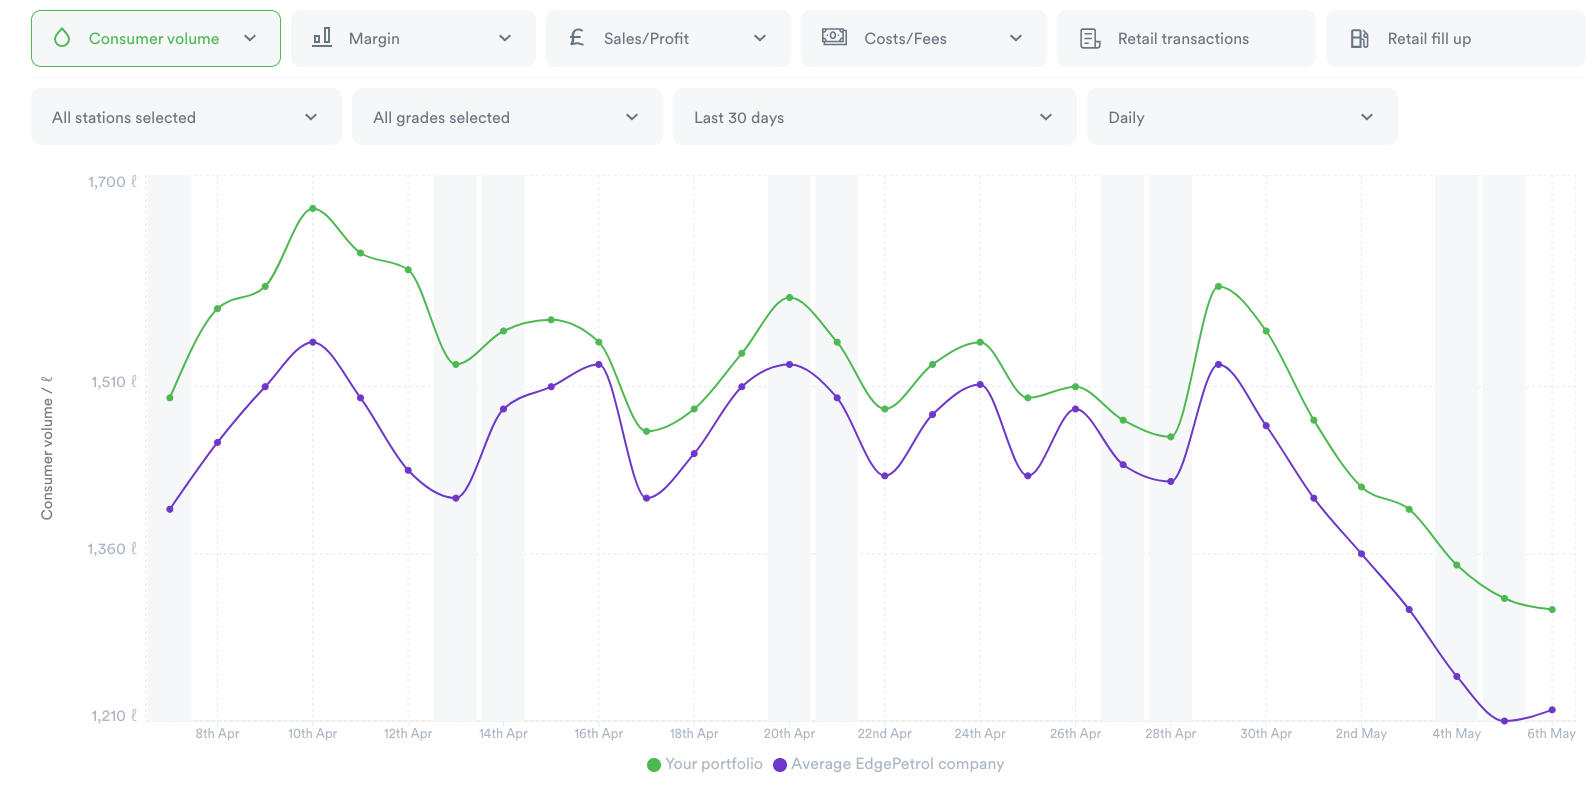
This leads to huge amounts of data insight, and to have it all presented neatly into a dashboard is simply revolutionary for a business. You can mix and match this data to find the best possible solutions for your business.
Optimizing your fuel retail business
Here at EdgePetrol, we are all about our customers. We understand the struggle of keeping in touch with changing times and the difficulty in having an Edge (pun intended) over the competition.
In simple terms, we provide software that gives station owners real time insight in a clean and digestible format, helping them fight off reducing volumes and aggressive competition.
Thousands of stations use EdgePetrol on a daily basis to make the best pricing decisions and have seen real positive change in their business, from confidence in decision making, to increases in volume and profits.
We understand that data can be overwhelming, and the reasoning behind our software is to facilitate your decision making and to present detailed insights regarding your business at the click of a button, with no manual entry. From breaking down your margins into gross and net, to calculating the cost of the fuel in your tanks, we understand the importance of data visualization and we present everything through our sleek design and interface.
Our Customer Success team is also on hand to make the transformation simple and to help you employ strategies that are profitable for your business.
If you have any questions or simply want to get to know us better, feel free to reach out at hello@edgepetrolstg.wpengine.com

