Spot trends and changes with
Period-on-Period Analysis.
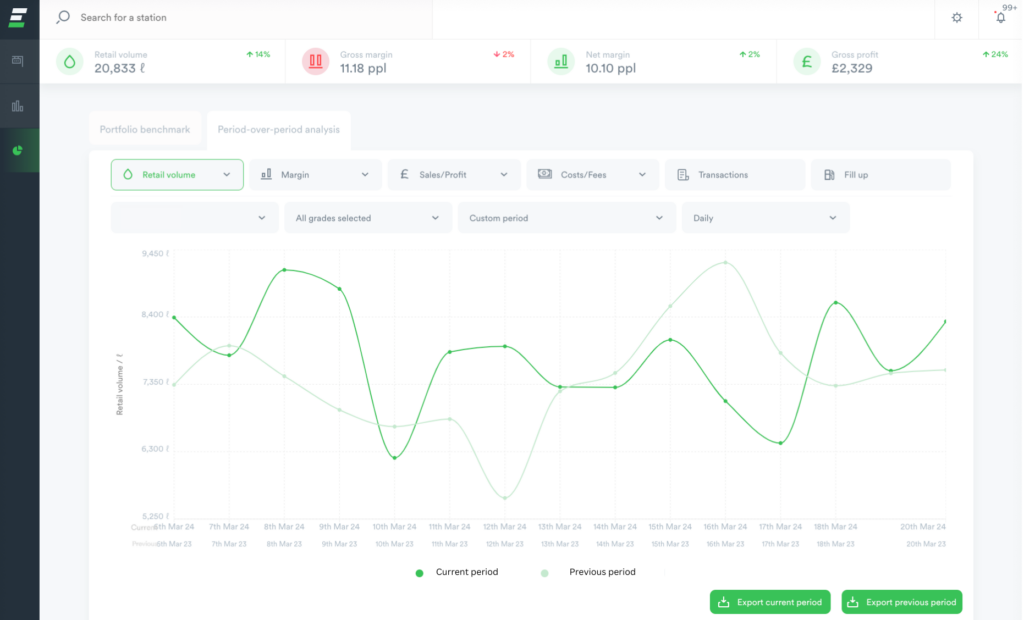
PoP Analysis provides an instant visual representation of performance, allowing EdgePetrol users with unrestricted access to compare all key metrics across any two periods in time.
As business costs rise and volatility returns to the market, fuel retailers like you need to find new ways to optimise their fuel profit.
You need to know:
How you are performing at any given point in time.
Whether your pricing strategy is having the desired impact.
If something unexpected is happening on your sites.
Set new pricing strategies.
EdgePetrol users have the benefit of instant visibility of site performance, driving decision making and strategy that increases volume and margin.
Now you can look back and compare automated and accurate data from anywhere in the world.
View performance reports on all your data points.
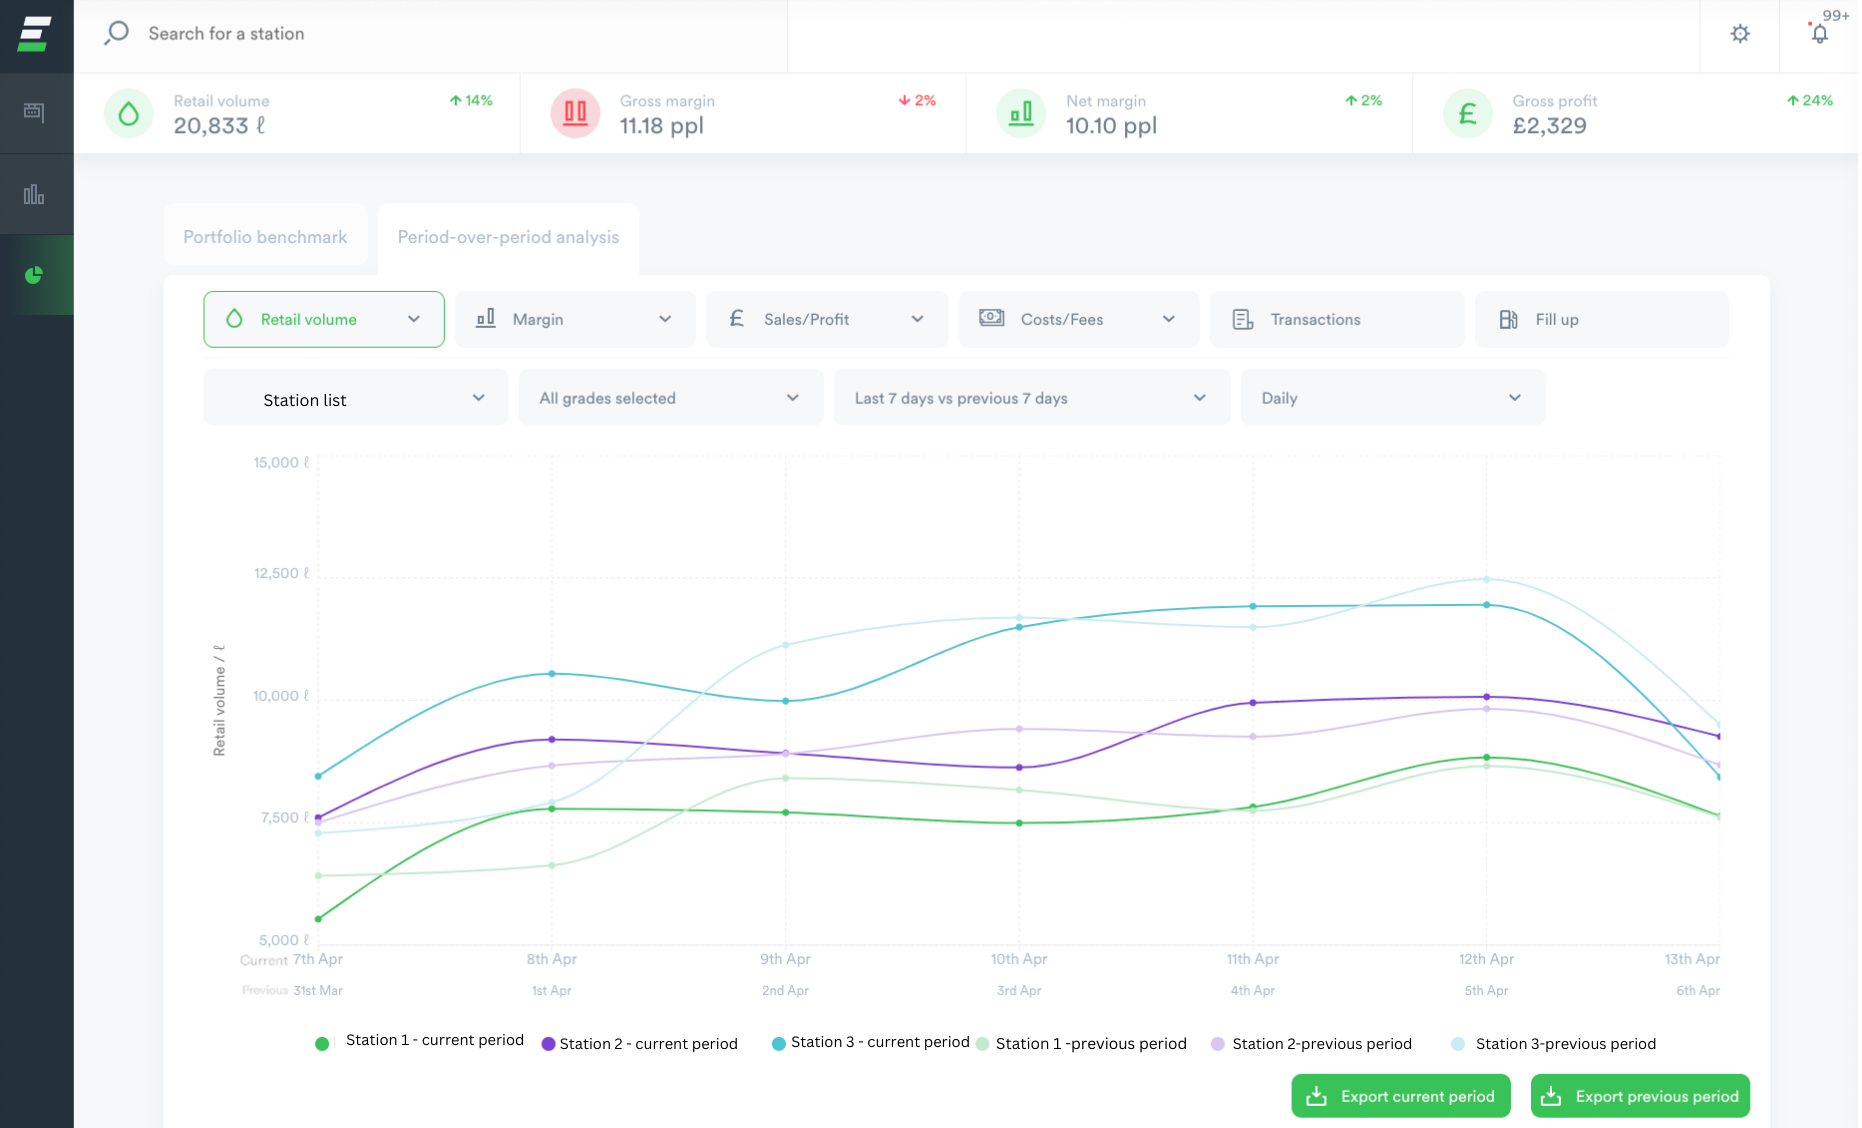
From transactions to cost prices, see all of your key metrics together in a consumable format, reportable against previous performance.
See how you are performing against your targets.
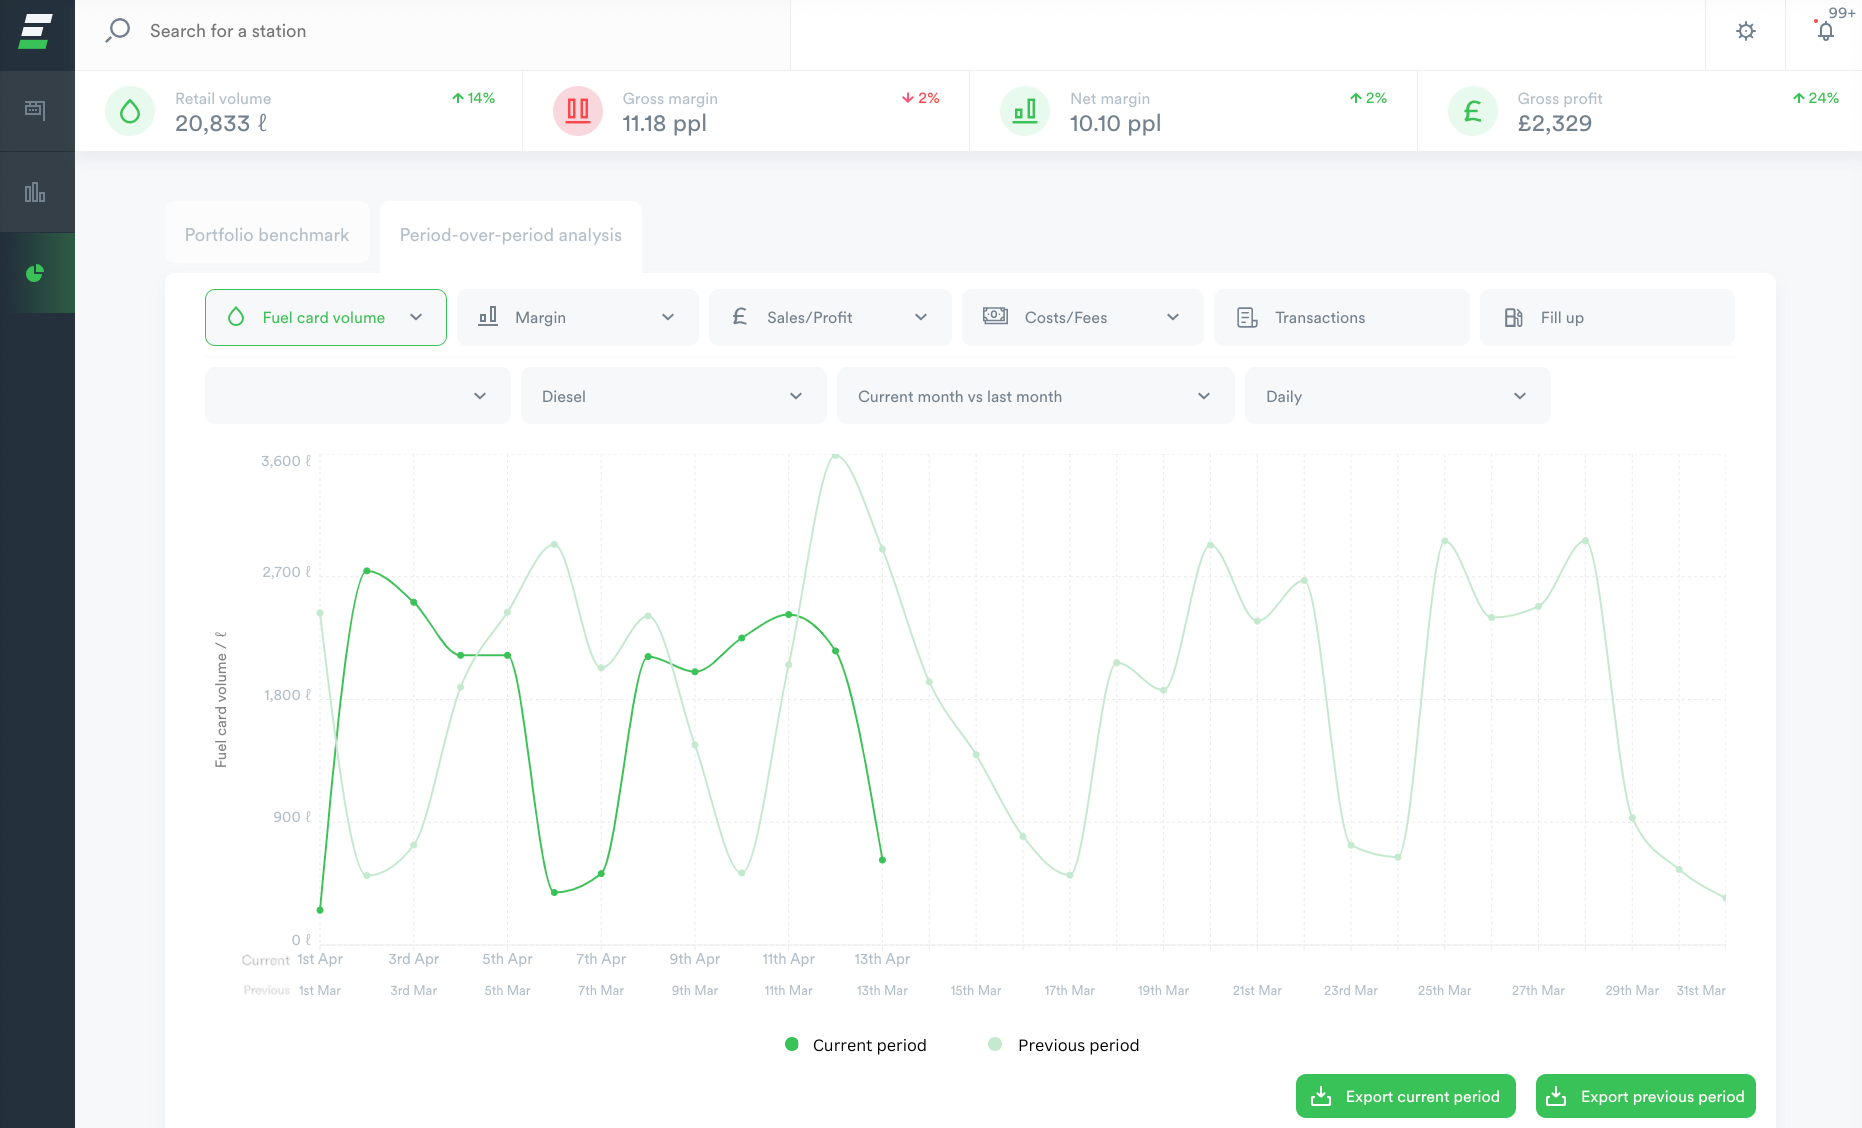
Compare volume, margin and profit metrics vs last year or any other time period to drill down into the causes of over-or-under-performance.
Validate your pricing strategies.
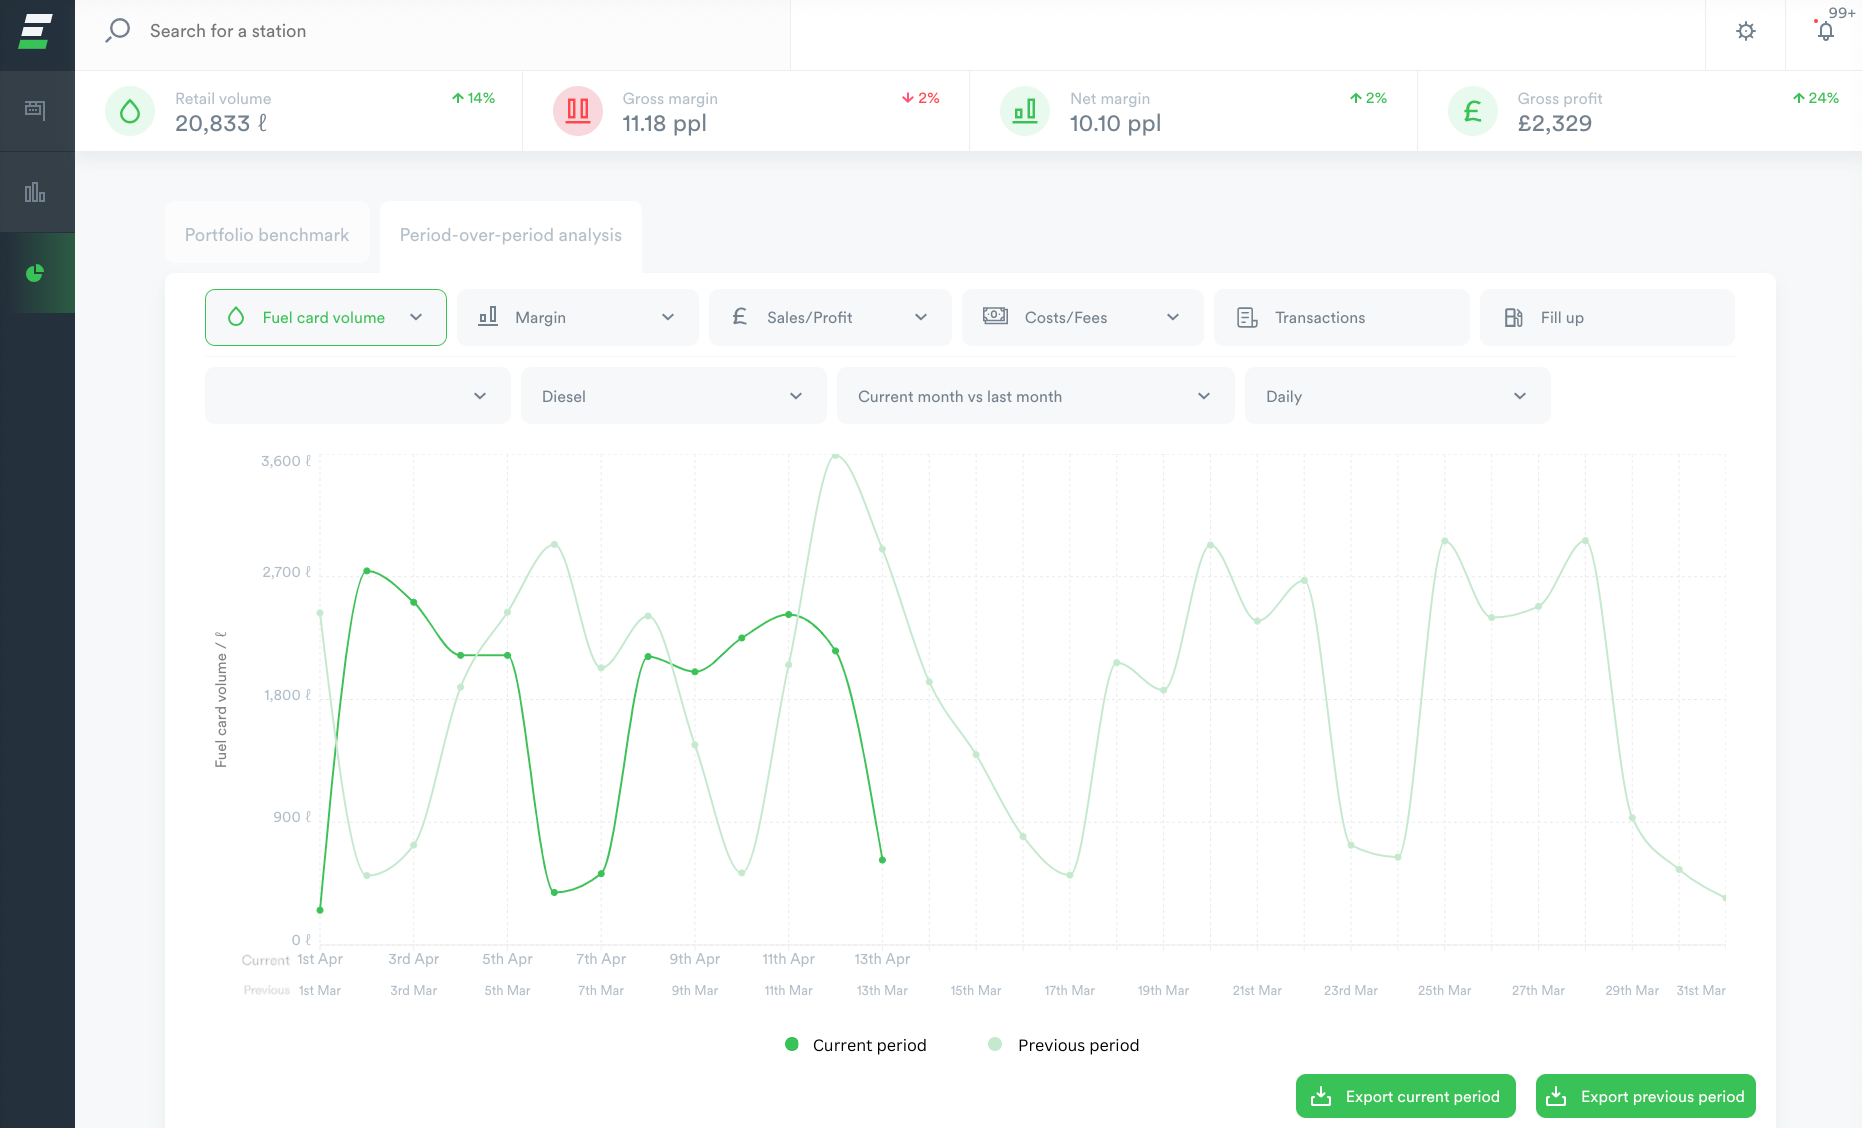
Know how your true consumer customers are responding to your pricing using ‘consumer volume’, net of fuel cards and bunkering.
Spot and respond to unexpected changes in key metrics.
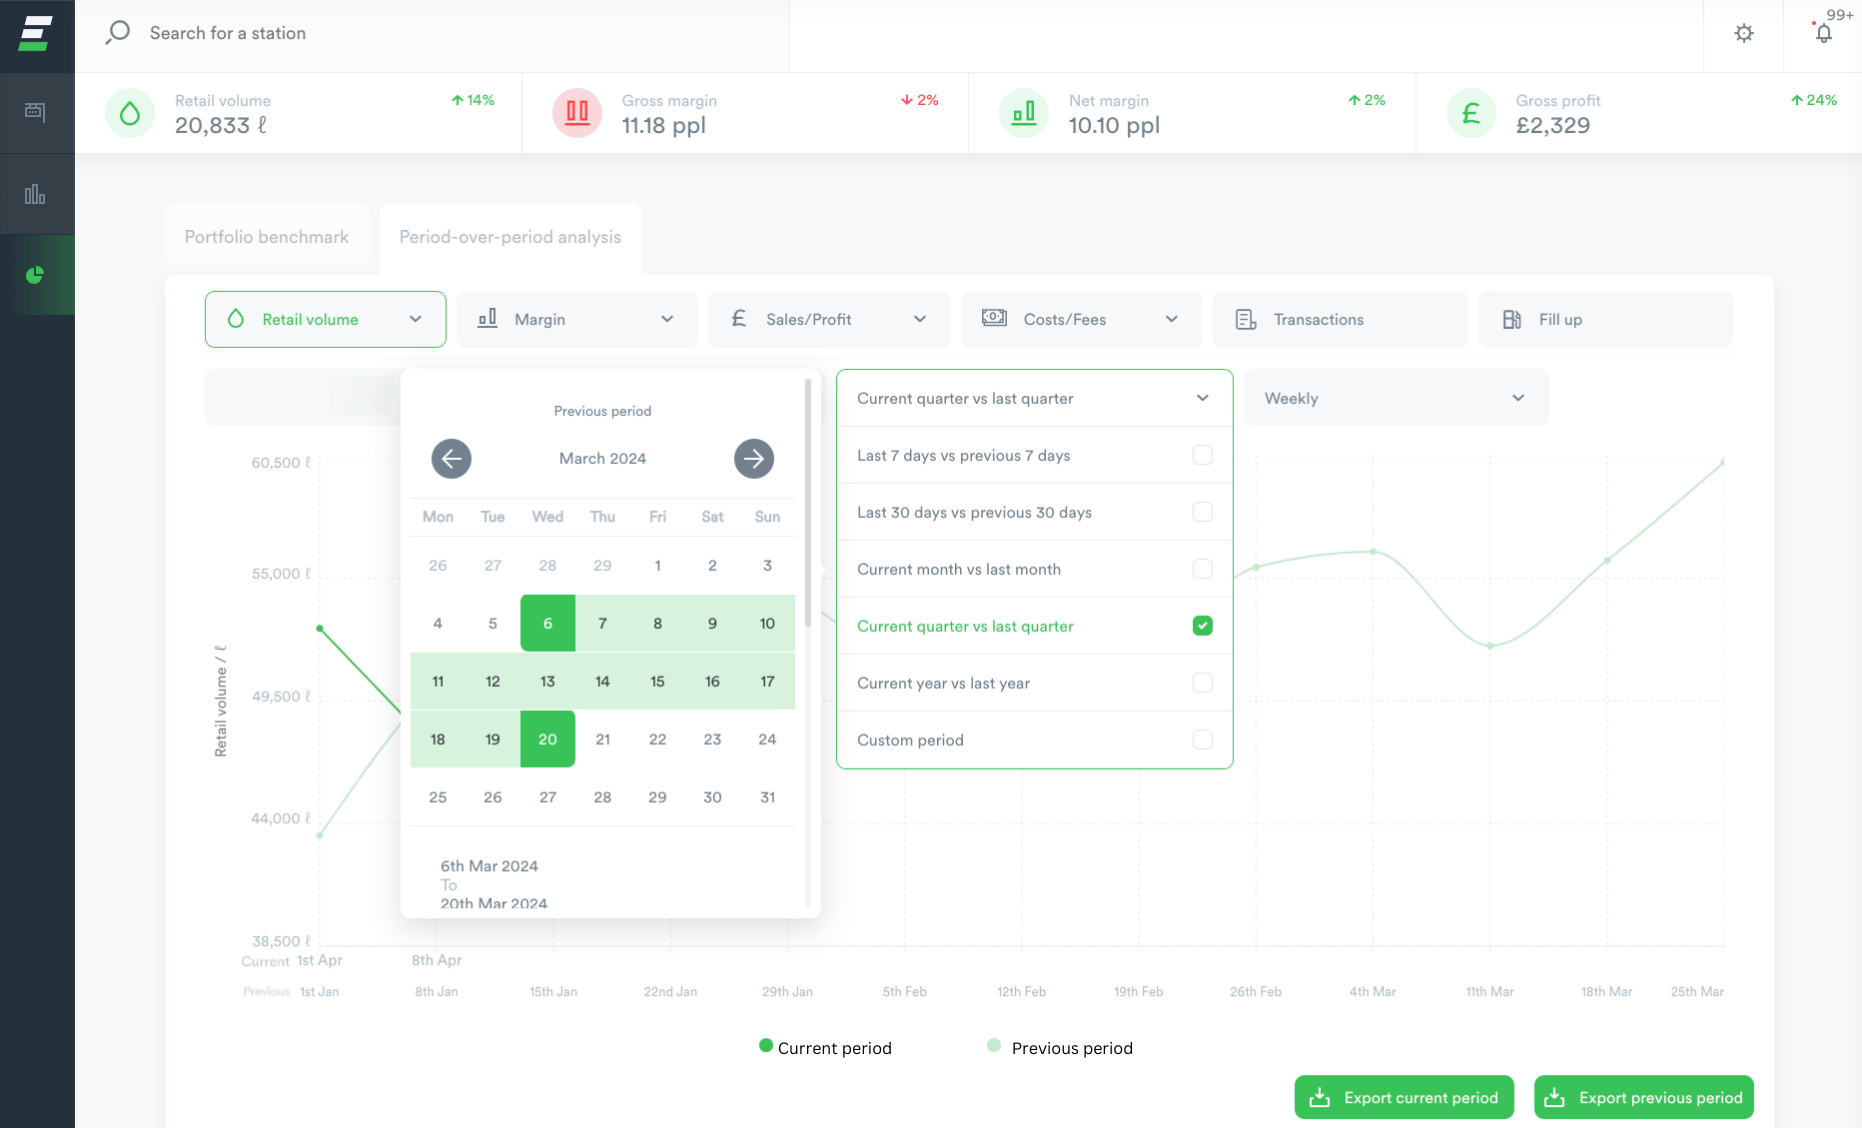
Spot differences between this year’s data and last year’s data to understand when your sites are not performing as expected. Visualise this by week, month and quarter.
Other key benefits:
Spot new trends to work out new pricing strategies that drive volume, margin and profit.
Ditch manual time-consuming spreadsheets that don’t show the whole picture.
Make sure you are on track to beat last year’s targets.
Build narrative for internal and external stakeholders including investors, banks and accounting teams.
Want to learn more about PoP?

Office
We are located in
London, UK
Texas, USA
Contact
+44 020 3865 8689
+1 512 265 8504
EdgePetrol 2024. All Rights Reserved.
