See how your site compares
to the market with
EdgeBenchmarking.

Even with live data it can be hard to know if the trends are unique to your site. Without knowing how the market is performing, you are left to make educated guesses as to whether you are making the right decisions.
This is why we built EdgeBenchmarking.
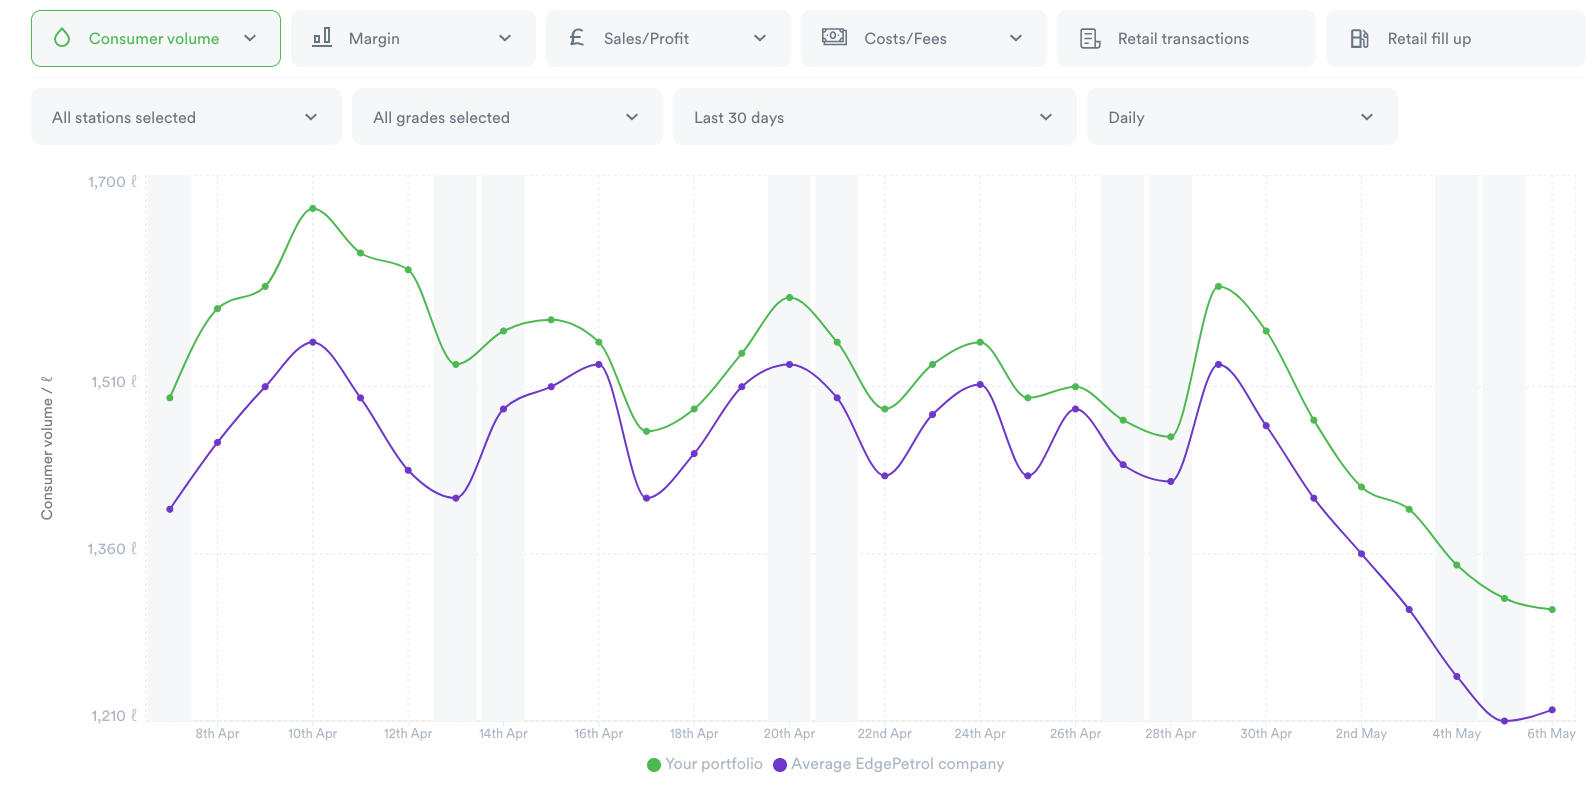
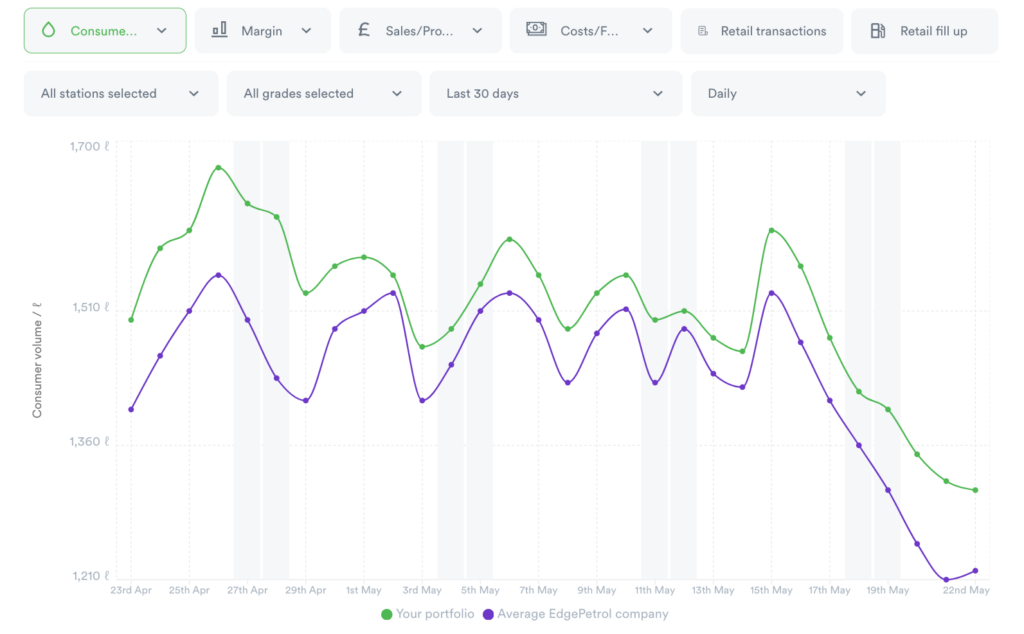
EdgeBenchmarking provides an instant visual representation of market performance over time versus the performance of your own sites.
It provides market data that is unobtainable elsewhere in a consumable format. This adds a huge new dynamic to the process of only using your data to make decisions.
See how you are performing against the market.
See how your sites compare across all key metrics, including new metrics like consumer volume (net of fuel card and bunkering) and old favourites such as gross and net margins.
Validate your pricing
strategies.
Gain peace of mind by knowing whether it is your pricing strategy influencing performance or the market is seeing the change too.

Prevent
impulse decisions.
Performance is not always unique to your site and can be unrelated to your decision making. Benchmarking data shows you whether your changes will actually have the desired impact.
Spot and respond to unexpected changes in key metrics.
Compare any key metric with market performance to spot anomalies. Visualise by week, month and quarter to determine when your site isn’t performing as expected and drill down into key metrics to discover why.
Other Key Benefits:
Set and track performance of pricing strategies, using performance against the market as a measure of success.
Build narrative to stakeholders, by explaining performance alongside market trends using consumable, accurate and organised data with a story.
Make sure you are on track to beat last year’s targets.
Build narrative for internal and external stakeholders including investors, banks and accounting teams.
Learn more about EdgeBenchmarking

Office
We are located in
London, UK
Texas, USA
Contact
+44 020 3865 8689
+1 512 265 8504
EdgePetrol 2024. All Rights Reserved.
